Long Term Hold - VGG
Vanguard U.S. Appreciation Index ETF
The following is a review of this ETF from the perspective of long term hold fire and forget investor who's goal is have their money retain it's purchasing power and ideally grow.
This analysis looks at understanding how often an investor in the past might have had success with the above stated goal. Mitcer Incorporated has developed a proprietary way of looking at the historical dividend adjusted end of day prices to provide visualizations of the data that shape this insight and allows for easily comparing and contrasting the sea of broad market investment vehicles.
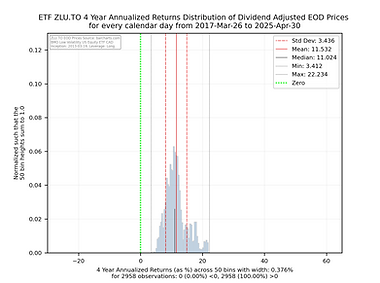
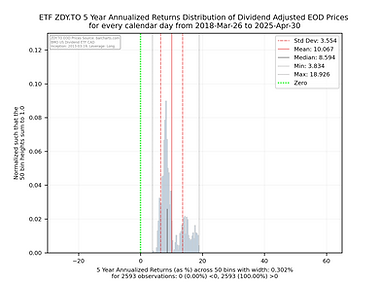
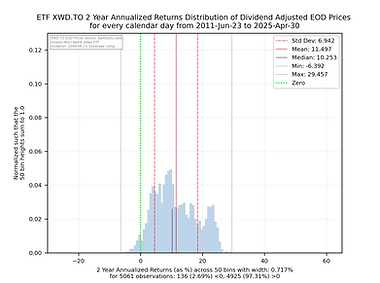
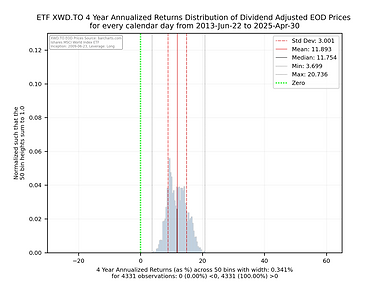
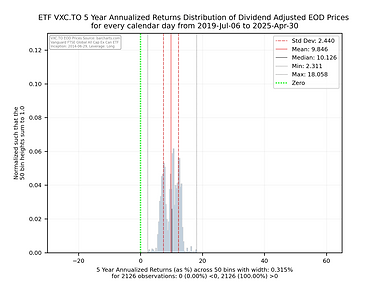
The 2 to 8 year annualized return histogram with embedded qqplot shows how quickly distribution spread shrinks the longer an investor stays invested.
Some things to consider when interpreting the histogram charts below.
-
The green vertical line shows you where an annualized return of 0 falls. Anything to the left will be a negative return. Anything to the right will be positive annualized return.
-
The y axis has been normalized so that the sum of the 50 histogram bin bars sums to 1.0 allowing one to compare and contrast the charts easily as their y and x axes are consistent in size and scale.
-
The shorter black vertical line is the median so you can see how close the median is to the mean.
-
The red solid line is the mean of the distribution and the dashed red lines would be the size of the 1st Standard Deviation if the distribution was considered statistically normal.
-
While some of these charts appear to be normal in shape, many are not so be carefully with relying too heavily on the statistics associated with the distribution.
-
The light grey vertical lines show the absolute min and max of the annualized returns of the distribution for the full set of observations.
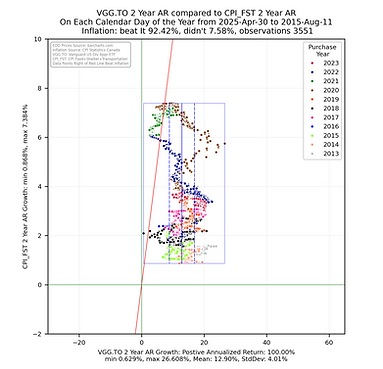
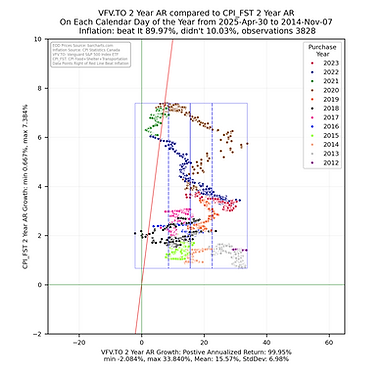
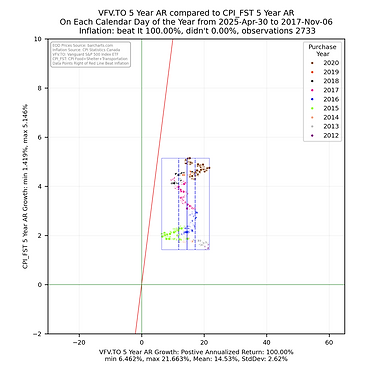
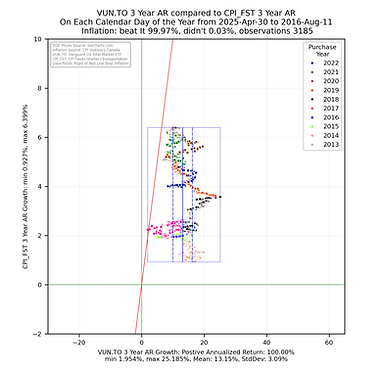
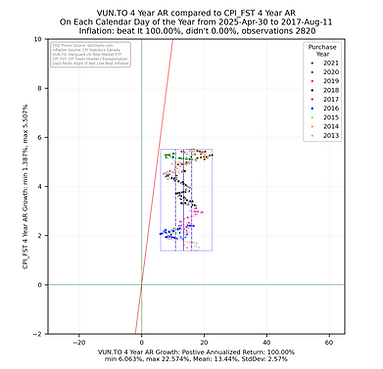
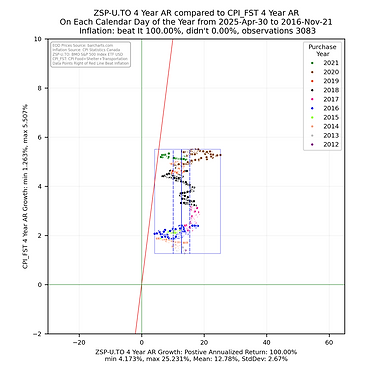
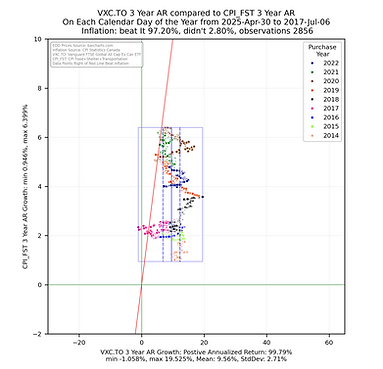
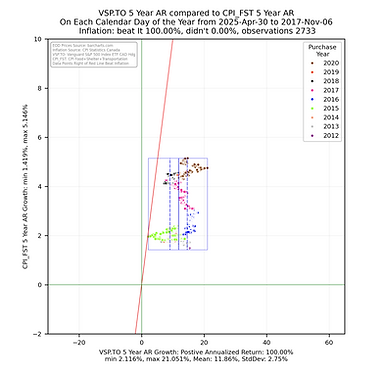
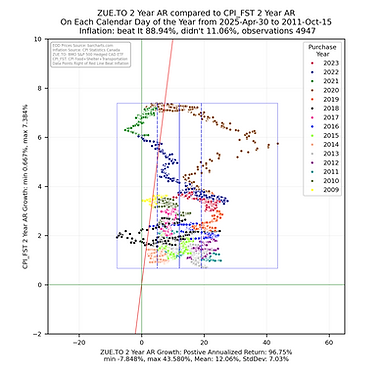
Some things to consider when interpreting the scatterplots above.
-
Each point represents the annualized return ending on the calendar day for the noted ETF being compared with the CPI growth for Food, Shelter and Transportation for the same calendar day.
-
The chart is square to ensure the aspect ratio between the vertical and horizontal axis remain equal to help with visualization.
-
The smaller the rectangle the less volatility in the returns.
-
The bounding box shows the range the the noted ETF annualized returns and annualized CPI growth fall between.
-
The red sloped line divides the data into points on the left falling short of inflation growth and data falling on the right beating CPI growth in the sum of the CPI Food, Shelter and Transportation sub groups.
-
The key take away is that the more points the fall to the right of the red sloped line the better the ETF has been at providing an annualized return that beats the annualized growth the CPI metric. The money invested did not lose purchasing power.
-
These views help to quickly show that the annualized returns for some ETFs are significantly better and providing returns that reduce the risk of loss of purchasing power.